
Retail Pulse Results of Post-Holiday Survey 2023
NATIONAL HOLIDAY SALES
During the 2023 holiday season, core retail sales in the United States grew by 3.8% compared to 2022, reaching a record $964.4 billion, surpassing the National Retail Federation's (NRF) forecast.
These results exceeded the NRF's prediction of a 3% to 4% increase in holiday sales compared to 2022. The 2023 figures, while reflecting a slower growth rate than the preceding years influenced by pandemic-related stimulus spending, align with the average annual holiday increase of 3.6% from 2010 to 2019.
The holiday sales data, not adjusted for inflation, incorporates online and non-store sales, which rose by 8.2% to $276.8 billion. This growth in online and non-store sales exceeded the NRF's forecast range of 7% to 9%, demonstrating the resilience of e-commerce during the holiday period. Notably, the online holiday sales for 2023 surpassed the previous year's figure of $255.8 billion.
November-December holiday sales saw year-over-year gains in all but two of nine retail categories. Specifics from key sectors for the two months combined, all on an unadjusted year-over-year basis, include:
- Electronics and appliance stores were up 9.3%.
- Health and personal care stores were up 9%.
- Online and other non-store sales were up 8.2%.
- Clothing and clothing accessory stores were up 3%.
- General merchandise stores were up 2%.
- Grocery and beverage stores were up 1.1%.
- Sporting goods stores were up 0.3%.
- Building materials and garden supply stores were down 3.9%.
- Furniture and home furnishings stores were down 6.2%.
Retailers were helped this year by the fact that Christmas fell on a Monday, giving consumers an entire weekend to do last-minute holiday shopping. In addition, retailers started their holiday promotions and deals as early as October this year.
LOCAL HOLIDAY SALES
Retail Alliance conducted two Retail Pulse surveys over the 2023 holiday period; one at the start of the holiday period and one at the beginning of 2024 to compare expectations vs reality of local retailers’ biggest sales period of the year.
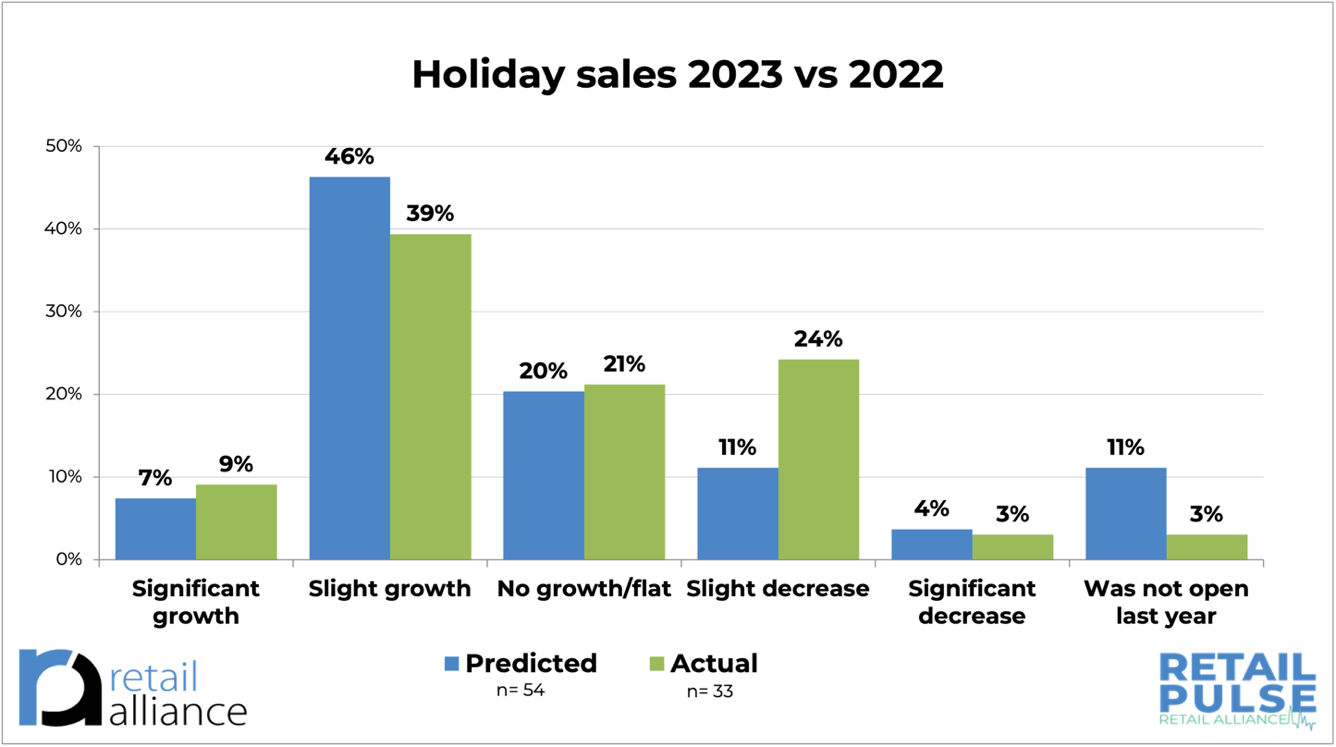
On a positive note, retailers’ expectations were similar to the actual results of their holiday sales. Unfortunately, growth was not as strong as predicted with just under half stating some level of growth but more people experiencing a slight decrease that they did not expect (11% pre-holiday vs 24% post-holiday).
One in five experienced flat sales this holiday season which is what they had predicted (20% pre-holiday vs 21% post-holiday).
ONLINE HOLIDAY SALES
Online sales are not a large part of small retailers’ sales locally. The majority (53%) of respondents stated that online sales make up 1-4% of their overall sales during the holiday sales period.
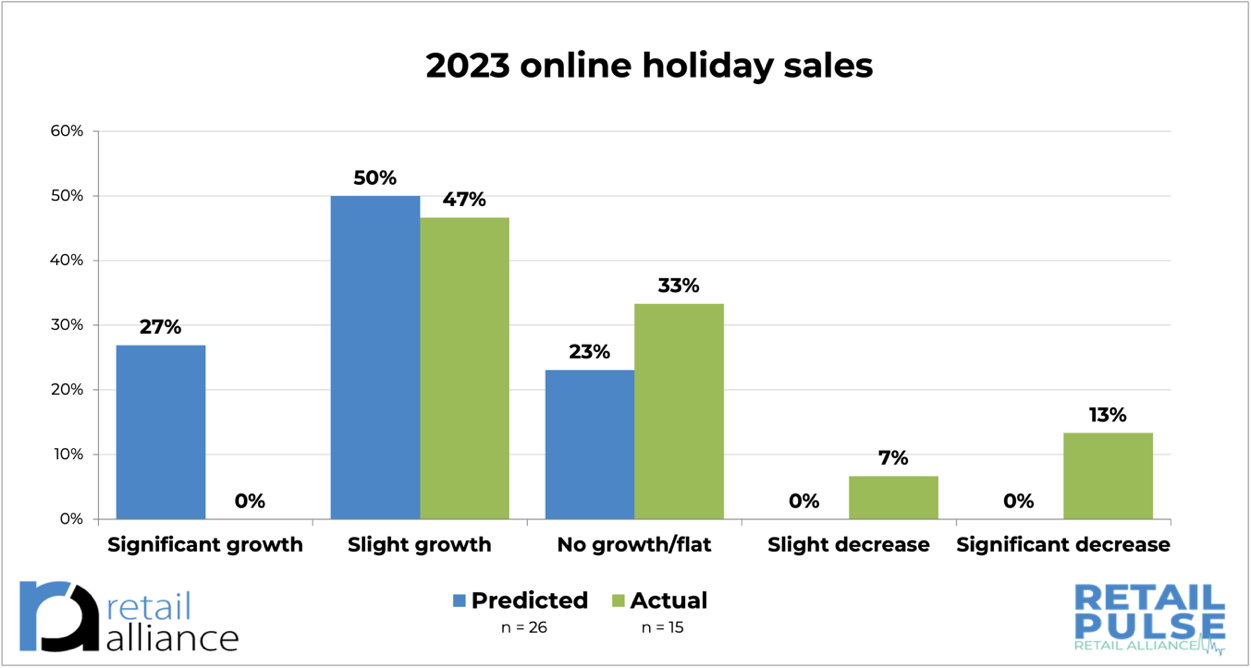
Nearly half of the respondents who sell online had slight growth over the holiday period (47%), close to their expectations. Over a quarter (27%) had expectations of significant growth over the holiday sales period but unfortunately no one (0%) experienced significant growth.
SERVICES OFFERED DURING THE HOLIDAY PERIOD
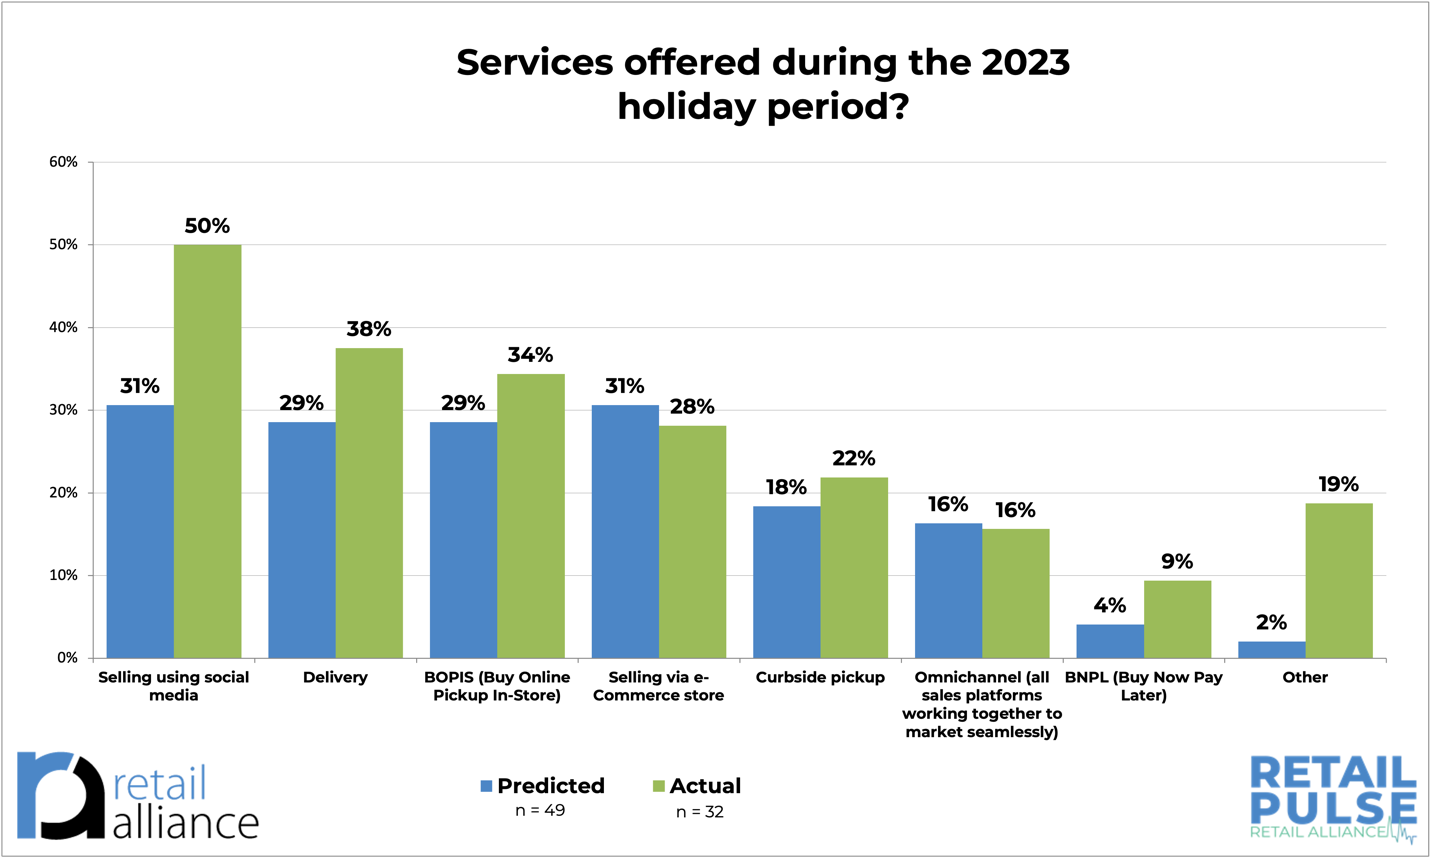
Social selling was popular with half the survey respondents during the 2023 holiday period. More people offered this service than thought they would (31% predicted they would offer vs 50% who said they did).
Delivery and BOPIS (Buy Online Pickup In-Store) were also popular services offered, more than was predicted, as shown in the chart above.
MARKETING EFFORTS DURING THE HOLIDAY PERIOD
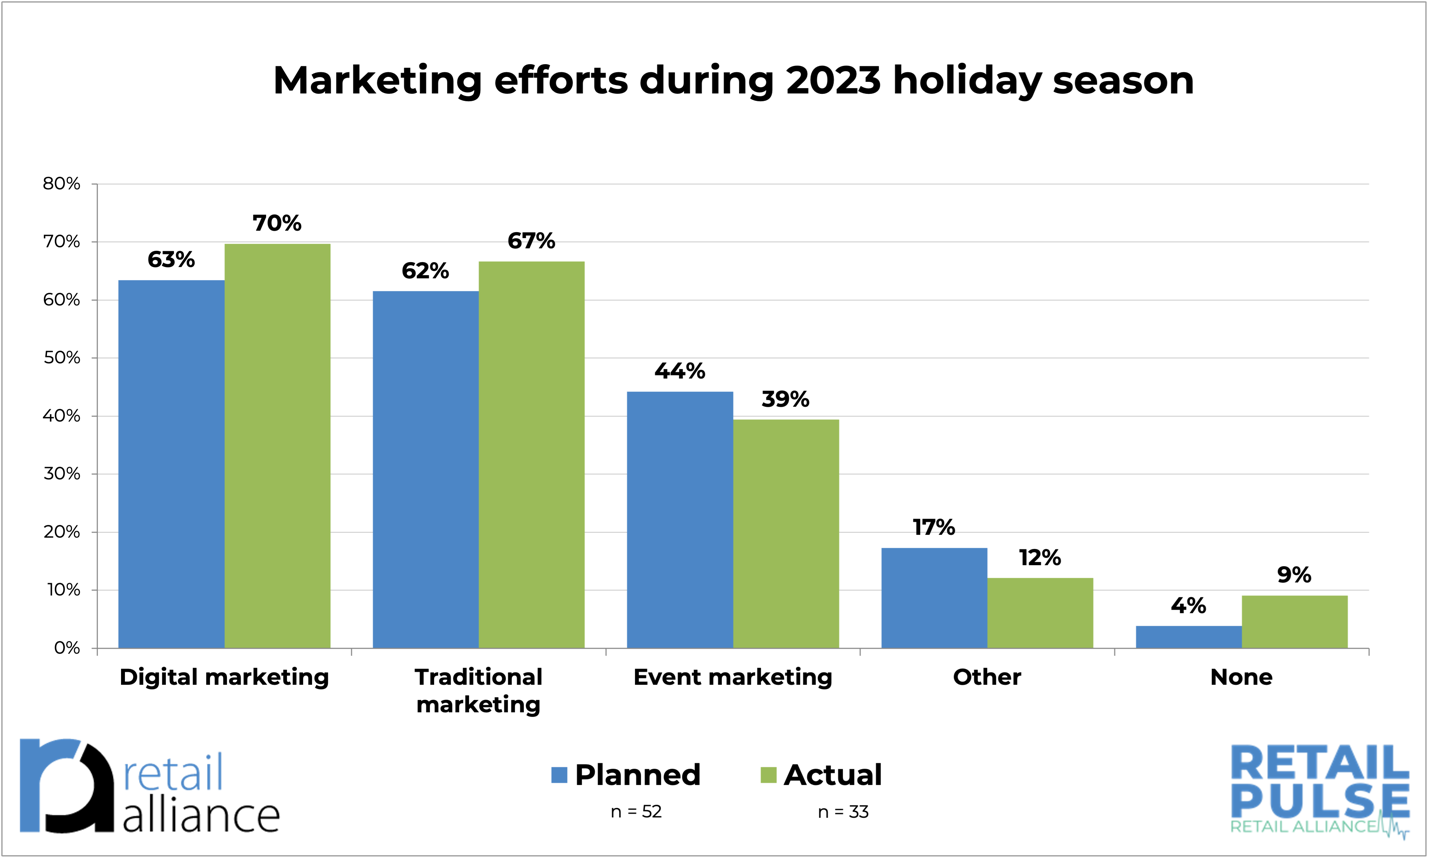
Digital marketing such as SEO, content marketing, email marketing, pay-per-click, affiliate marketing, social media marketing, and mobile marketing came out ahead as channels used by the most retailers during the holiday period (70%), although traditional marketing such as direct mail, personalized marketing, word of mouth, cause marketing, brand marketing, and public relations was not far behind (67%).
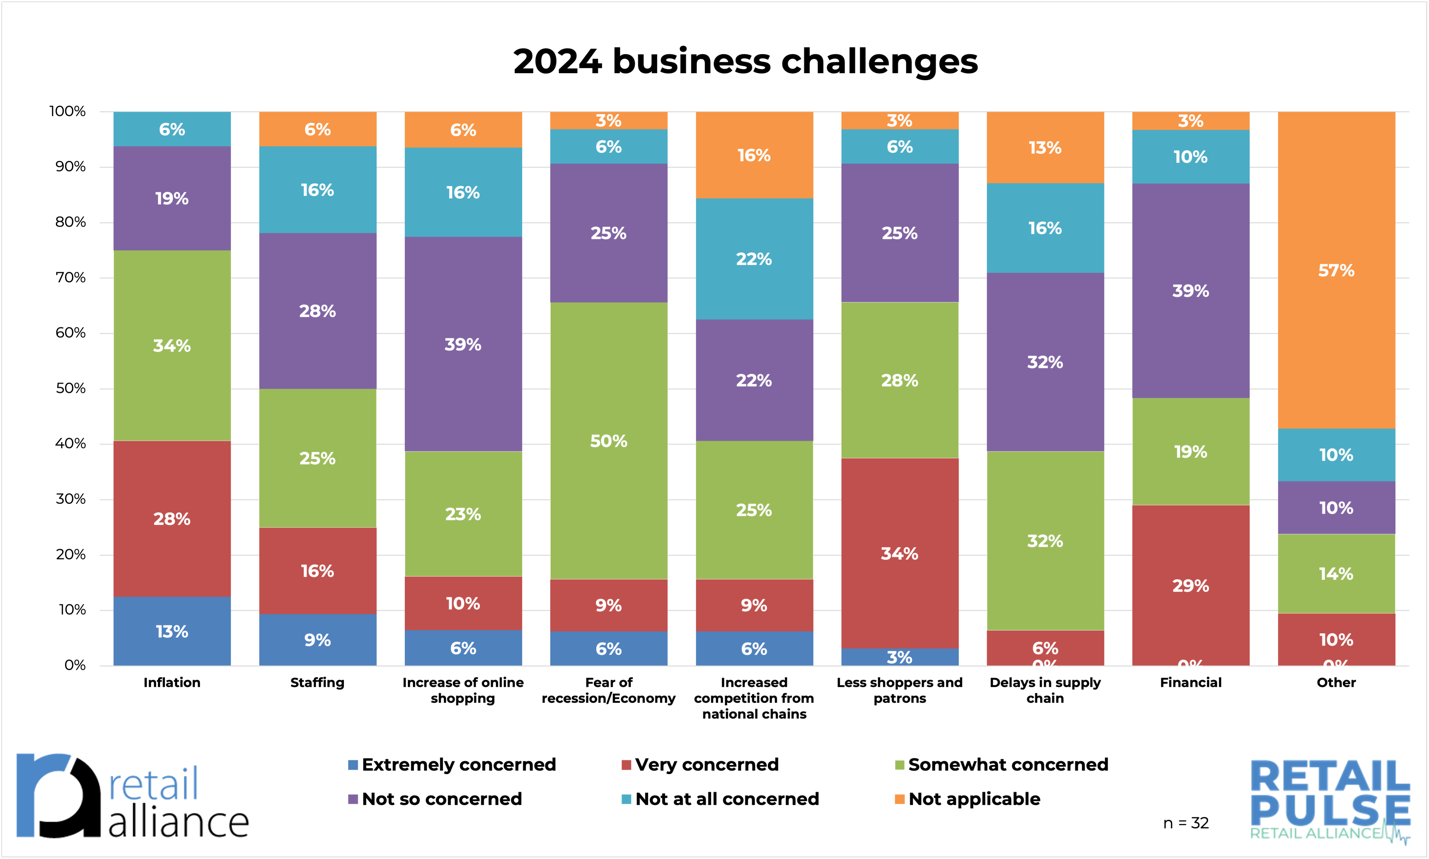
2024 BUSINESS CHALLENGES
Many challenges local retailers are facing this holiday are a continuation from previous surveys such as Inflation, Economy, Staffing, and Financial concerns.
This is reflected on a national level with the NFIB Small Business Economic Trends survey conducted in December. Inflation was a top business concern in their survey, and 40% of small business owners reported unfilled jobs, unchanged from November.
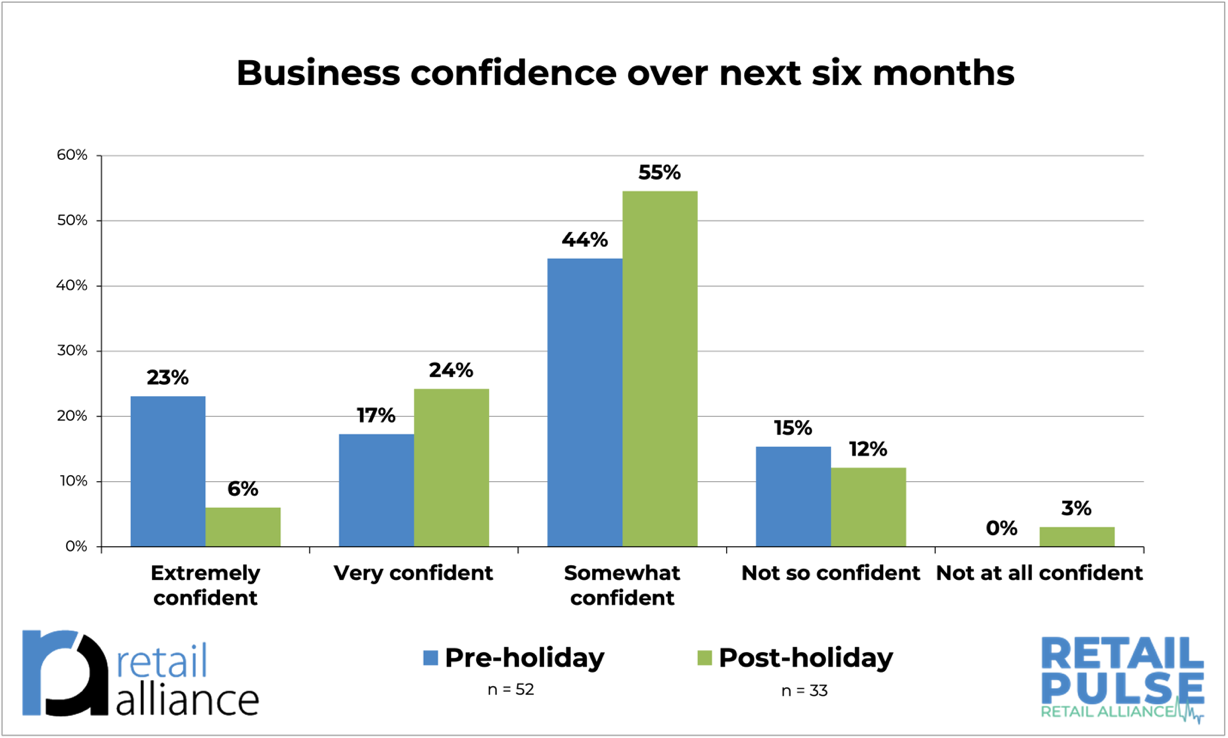
BUSINESS CONFIDENCE OVER NEXT SIX MONTHS
Confidence remains strong for business owners over the next six months according to the survey. Unfortunately, the level of confidence has dropped from the pre-holiday survey as you can see in the bar graph below. Twenty-three (23%) of respondents said they were extremely confident when asked back in November 2023. This dropped to six percent (6%) after the holidays.
A BRIEF GLIMPSE AT NATIONAL FULL YEAR RESULTS
Despite ongoing inflation and high interest rates, the full-year sales for 2023 saw a significant increase of 3.6% over 2022, totaling a record $5.13 trillion according to the National Retail Federation. The economy showcased consumer resilience, with spending defying recession concerns as individuals continued to spend despite inflation and increased borrowing costs. The tight labor market, a "wealth effect" from rising home and equity prices, and pandemic-driven savings contributed to a solid 2.3% growth in inflation-adjusted gross domestic product over 2022.
ABOUT RETAIL PULSE
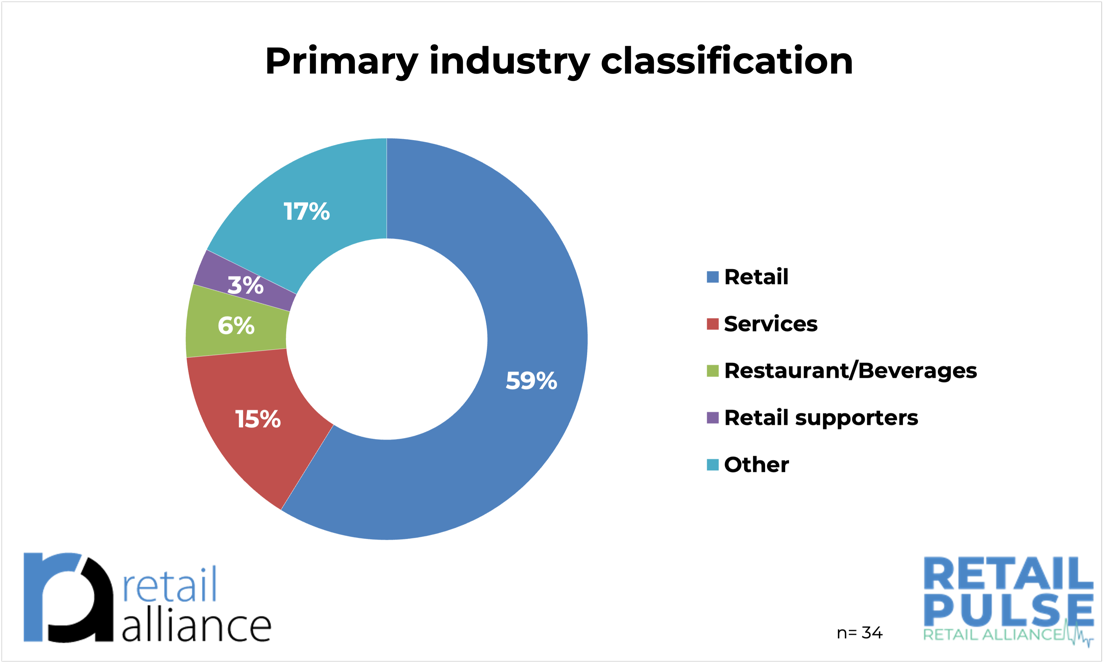
Retail Alliance’s latest Retail Pulse survey was conducted between January 2 and January 8, 2024 and received 33 responses from retailers, restaurants, services, and other small businesses, throughout Hampton Roads.
The previous Retail Pulse survey was conducted between November 15 and December 8, 2023. The survey received 57 responses.
ABOUT RETAIL ALLIANCE
Retail Alliance champions for the retail industry and serves as the primary non-profit retail trade association in Hampton Roads. At Retail Alliance, we unite with retailpreneurs for a thriving retail community through professional development, collaboration, innovation, a collective voice, and shared values, shaping the future of retail together. We are celebrating our 120th anniversary in 2023. www.retailalliance.com